All modern web browsers have built-in developer tools that are essential for web development. By now you’ve also likely heard about or maybe even used the axe DevTools browser extension for Google Chrome, Microsoft Edge, or Mozilla Firefox. The axe DevTools extension is incredibly useful for finding and fixing accessibility issues without having to be a skilled accessibility expert.
When you combine the built-in web developer tools with the power of the axe DevTools Extension, you can multiply the effectiveness of your web development and testing. In this post, I’ll be primarily focusing on tips for Google Chrome DevTools, but keep in mind most of these tips and tricks will translate to other browsers as well.
Before we begin, it is important to understand how to open Chrome developer tools. There are keyboard shortcuts or mouse click options to open the developer pane. I find the quickest way is to right-click anywhere on the website you want to test and then select “Inspect” from the menu. Once the developer tools have been opened, you can switch to the axe DevTools tab and get started. Check out this article for more detail.
Tip #1 – Change the browser extension options
When you first install the axe DevTools browser extension, it will not have permissions to run in an Incognito/private browser session. It will also not have permission to run on a file URL. These permissions can be allowed by navigating to the extensions manager (chrome://extensions/) and clicking on the button labeled “Details” for the axe DevTools – Web Accessibility Testing block. Once you’ve arrived at the details page you can toggle the “Allow in Incognito” and “Allow access to file URLs” options on.
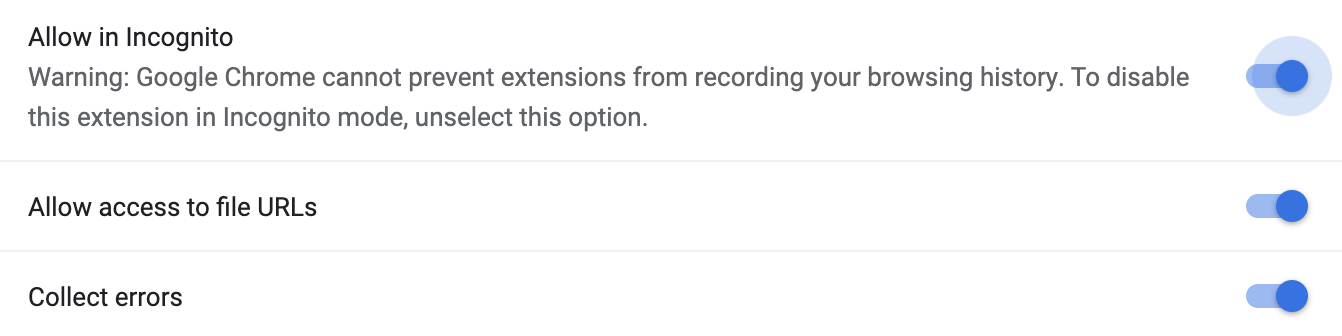
Now, if you open an HTML document that is not served through a web server, you can still run the automated and Intelligent Guided Tests! You can also do this while using incognito mode.
Tip #2 – Emulate Devices
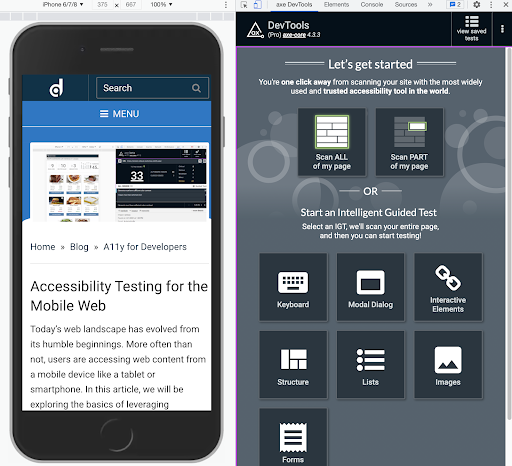
In my last article, I covered how to use Chrome’s DevTools to emulate devices so you can test responsive pages or layouts. Not much has changed since then, but it is worth mentioning that you can emulate the viewport sizes for a variety of popular devices like iPhone X, iPad Pro, Galaxy S5, etc. There is a button to toggle the rotation from portrait to landscape or throttle the network speed. Extra pro tip: open the 3 button menu for even more options and features.
Tip #3 – Element Inspector
This is a broad topic due to the fact that there are so many important features in the element inspector.
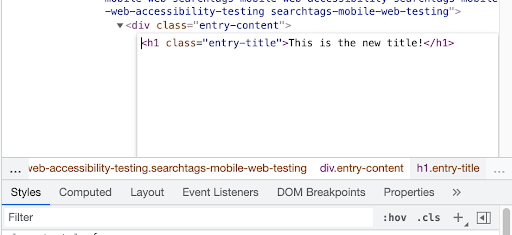
3.1 Edit as HTML
Did you know the front-end markup can be modified? It’s easy to do and gives you a way to test your changes before going through the process of source implementation. When axe DevTools finds an issue, use the element inspector link to get to the element source.
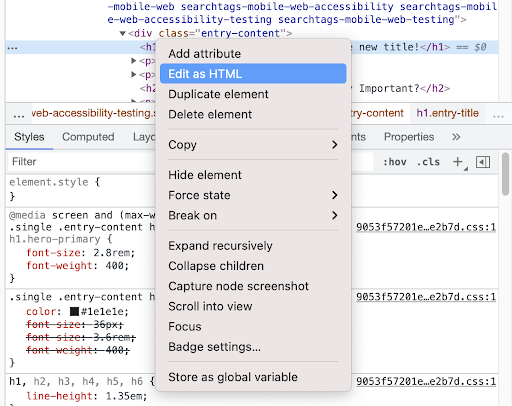
You’ll then be able to use the provided solution options to modify your markup and test the fix.
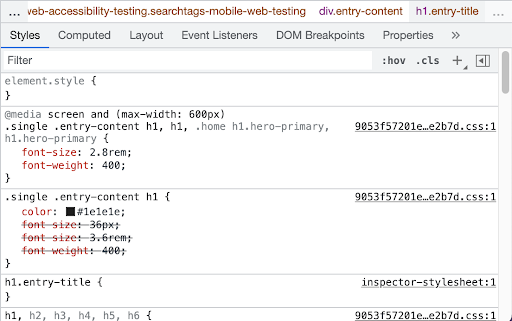
3.2 Style Editor
CSS can be a chore to learn at first. The CSS editor makes this a lot easier to understand. Use the Styles pane in the element inspector to modify and set new properties in real-time! There are other helpful tools like box-shadow, flex, and color widgets to help choose the values for your design. This also comes in handy when fixing accessibility issues that need style adjustments.
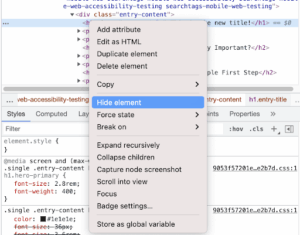
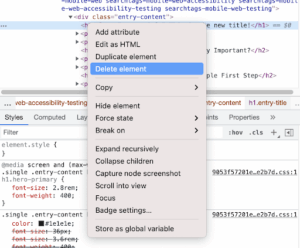
3.3 Hide or Delete Elements
I’ve often found that testing an individual element or component of a page is helpful for focusing the results. There are times, however, when I need to test the whole page except for a specific component. This can be accomplished by using the Hide or Delete Element actions. To use these actions, navigate to the element inspector and find the element you want to remove. Open the right-click context menu and select the “Hide Element” or “Delete Element” options. At this point, you can run the axe DevTools tests and you won’t see any test results for the removed elements.
 .
. 
Force State
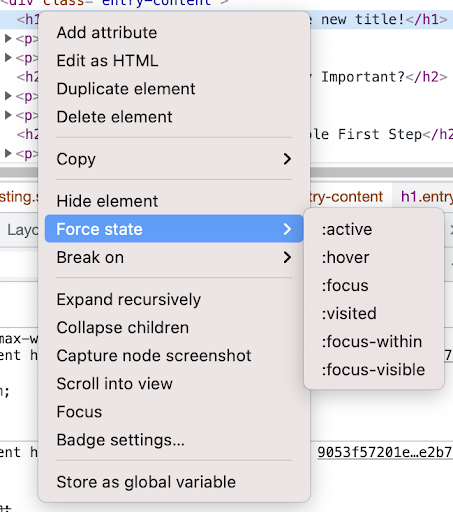
Similar to Hide or Delete Elements, you can force a state on a given element. Open the context menu again and look for the “Force State” option list.This can be used for a number of practical purposes, but one of the most common use cases is to test the active, focus, or hover state of button/link elements. It’s important to consider the color contrast of these states to ensure you’re providing an accessible experience. You can also use this feature to expose tooltips or other items that may only show on during these states.
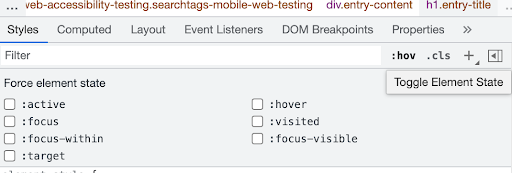
Below is a screen capture of the Google Chrome Styles inspector with checkbox options to toggle the Force element state between active, hover, focus, visited, focus-within, and focus-visible.
Conclusion
The axe DevTools browser extension is powerful, but having some fundamental understanding of how to use the built-in browser developer tools will make your testing even more effective. Do yourself a favor and learn about these tools and features of your favorite browsers’ devtools– they will exponentially increase your productivity and make your life a lot easier, while also helping to create an accessible experience for your users.