The Android Analyzer: What It Does
What is the Analyzer? It’s a tool intended to aid developers in creating accessible Android applications by allowing them to integrate accessibility testing into their normal development workflow. Its rules are developed according to the Deque way and are in conjunction with the developing WCAG mobile standards. The Analyzer is built for both manual and automated testing and can be configured to meet developers needs. Developers can control which of Deque’s accessibility rules are run, how the results are displayed, and the highlight color on the device.
Simply put,the Android-A11y-Service is an Android accessibility service. When it’s enabled it runs on top of Android activities and analyzes their content for accessibility issues.
This is how it works: the view hierarchy is scanned every time an event occurs that changes window view content. Accessibility issues are then highlighted on the screen, with a border around the offending view. The Analyzer also creates a simple TCP Socket listener that sends an HTTP Response for simple REST calls. This allows you to view real time results from a browser that reflects what’s being shown on the device. The Analyzer then produces an HTML report with these details, with explanations on how to fix the issues.
Features & Abilities
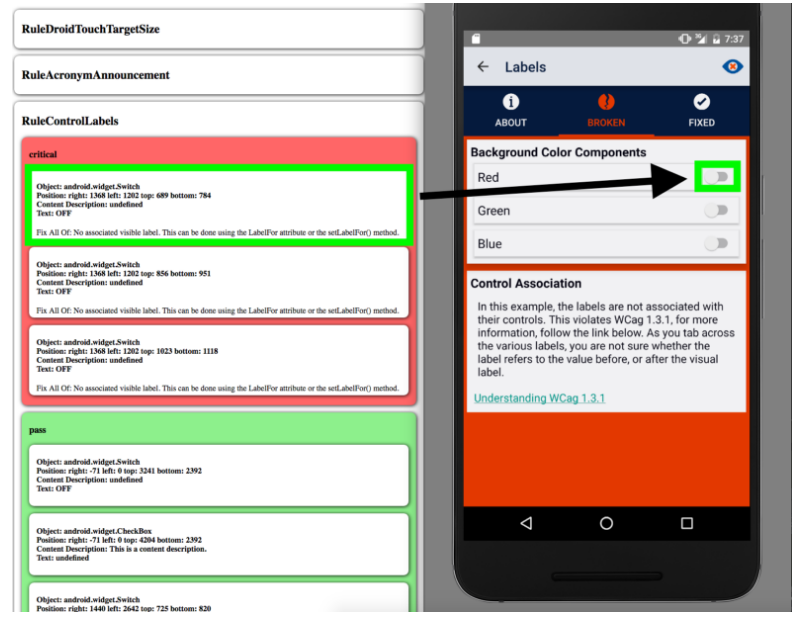
The image below depicts two main ways you can interact with the Analyzer. Later on in this post, I’ll explain info that’s displayed in the screenshots in greater detail. The image below serves as a kind of introduction as to how the Analyzer works by displaying the visual results (both on device and on a connected computer through a browser).
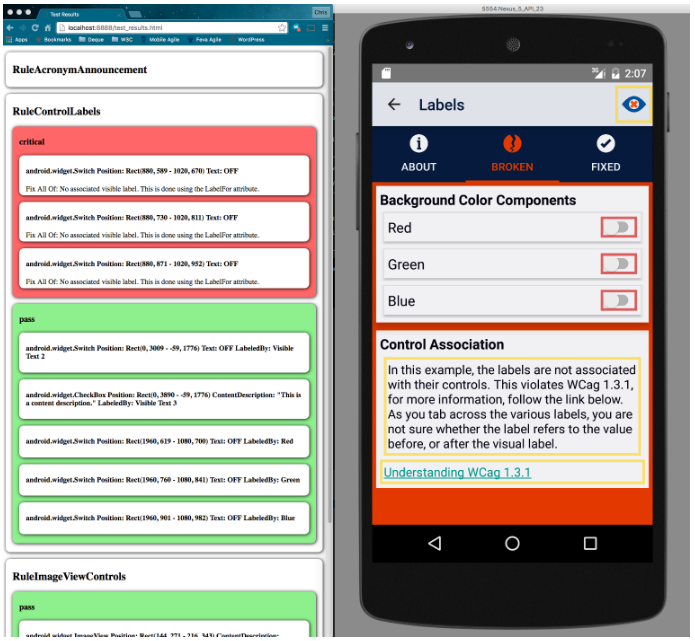
Notice how there are red highlights around the On/Off switches. These highlights aren’t from the application, but from the Deque A11y Analyzer service that’s running on top of the application. You’ll notice a simple web view on the left. The analyzer launches a simple HTTP server* that allows you to connect to the service when you need more information about specific violations. You can also click on specific violations from the web console and highlight them individually.
*More information on that below under “Rest API”
Example with Deque University
Deque’s demo app, Deque University for Android, demonstrates many accessibility issues that occur in Android apps. It’s available and open sourced on GitHub. The app has intentionally inaccessible content that is used to demonstrate the Analyzer’s capabilities. Let’s look at an example from the app to see how the Analyzer works.
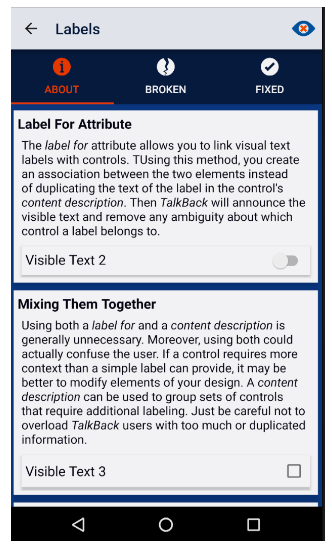
First, we’ll navigate to the Labels page through the app’s main menu. The “About” tab describes Labels in the context of Android APIs and explains their usefulness for both accessibility and usability.
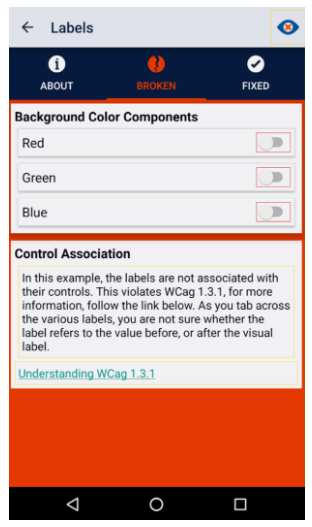
Now let’s look at the broken tab of the same page. With the analyzer on, the three switches are highlighted in red to indicate an accessibility failure. In this case, the switches are inaccessible due to a lack of associated visible label that’s helpful for both sighted and non-sighted users.
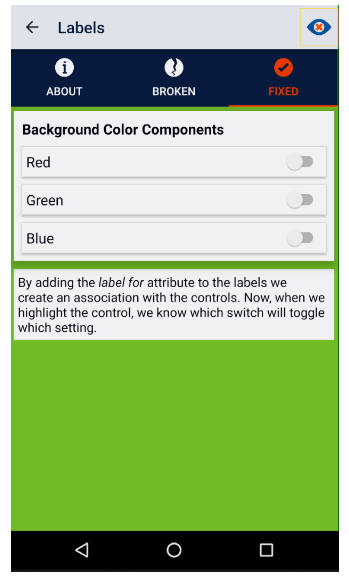
Once you navigate to the fixed page, you’ll see that the Analyzer no longer highlights the switches. That’s because they’ve been correctly associated with their visible label.
The rest of the app is set up in a similar way that both demonstrates and highlights accessibility issues specific to the Android platform. The app is a useful companion to understanding and using the Analyzer.
Manual Testing
The Analyzer’s manual testing options allow users to quickly understand the state of an Android application’s accessibility. By highlighting inaccessible nodes on the device, users can actually pinpoint the location and severity of the errors present. Beyond just a visual scan, users can also discover more details about which nodes are affected. They can learn about the types of issues and how to fix them by accessing the Analyzer’s HTML output.
HTML Output
As I discussed earlier, the Analyzer will automatically highlight views with accessibility issues on the device being tested. While it’s obviously important to be notified about the existence of an accessibility issue, understanding the type of issue – and how to go about fixing it – is the ultimate goal. Luckily, the accessibility service has a simple HTTP REST API that you can ping in order to get more information about specific failures.
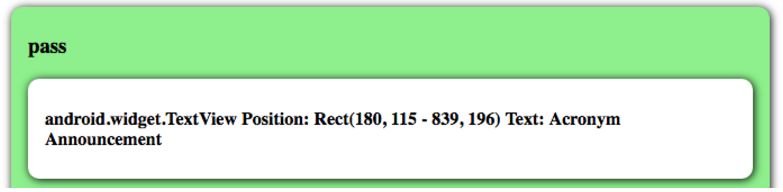
Every screen tested by the Analyzer can provide the user with a detailed HTML report (also available as a JSON object) by sending a request to the server the Analyzer sets up. The report is separated by rules. Each rule section is also separated by views scanned by that rule. These fall into one of three categories: pass, moderate, or critical. You can see images of each result type below.
Pass: the given Rule applied to that node, and the node passed.
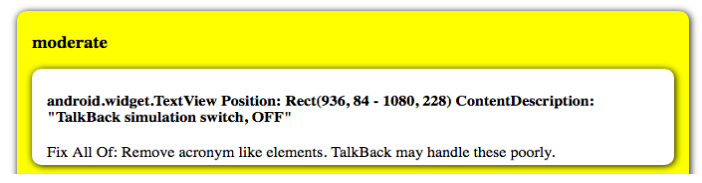
Moderate: the given Rule applied to that node, and it may have an accessibility issue.
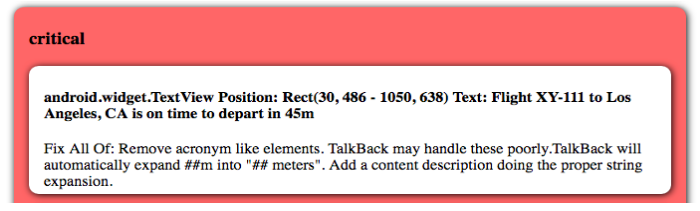
Critical: the given Rule applied to that node, and it has an accessibility issue.
An additional feature of the manual assessment output is the ability to find out which node was triggered by each report. Simply click on the text of any node’s output and you’ll see the corresponding node on the device is highlighted in green (or whichever color you configure in the settings).
Automated Testing
The automated testing features of the Analyzer allow developers to integrate accessibility testing into their existing test suite. The Analyzer’s output is consistent across manual and automated testing and provides details to aid developers in fixing the accessibility errors. There are two ways to integrate the Analyzer’s automated testing capabilities into your platform: using the Analyzer’s assertion library and using Calabash to run the analyzer on apps.
Unit Testing with Assertion Library
At the heart of any testing process is unit testing. Android Studio has powerful support for unit testing in the form of JUnit 4, instrumentation tests, and espresso automation tests. The Analyzer provides support for all of the unit/integration testing approaches and more. All of this comes with the same engine, rule set, and reports that you are accustomed to seeing if you’re using the manual assessment approach.
Results from tests are displayed in the developer console of Android Studio. They have the same information displayed using manual testing as I mentioned before.. Check out this simple example of results from a test run using the Control Labels rule.
| —————- RuleControlLabels —————-
Rule Description: Basic controls require a label for or contentdescription attribute. FAIL: android.widget.Switch Position: Rect(880, 655 – 1020, 736) Text: OFF Fix All: No associated visible label. This is done using the LabelFor attribute. —————- RuleControlLabels—————- expected:<PASS> but was:<FAIL> |
Notice the typical JUnit style “Expected <Pass> but was <Fail>” has some additional information placed before it. This is output from AxeAndroid to help you fix the given accessibility violation. In this case I need to add a LabelFor attribute to a Switch control. Finding out which switch triggered the failure should be simple with the manual assessment tool.
Unit Testing with Calabash Integration
Calabash is a useful tool for automated testing. Using Deque’s step definitions, Deque’s accessibility testing can be easily incorporated into existing Calabash tests. The results from accessibility testing done through Calabash are catalogued in the same way as other Calabash tests. Here’s an example of tests run on Deque University.
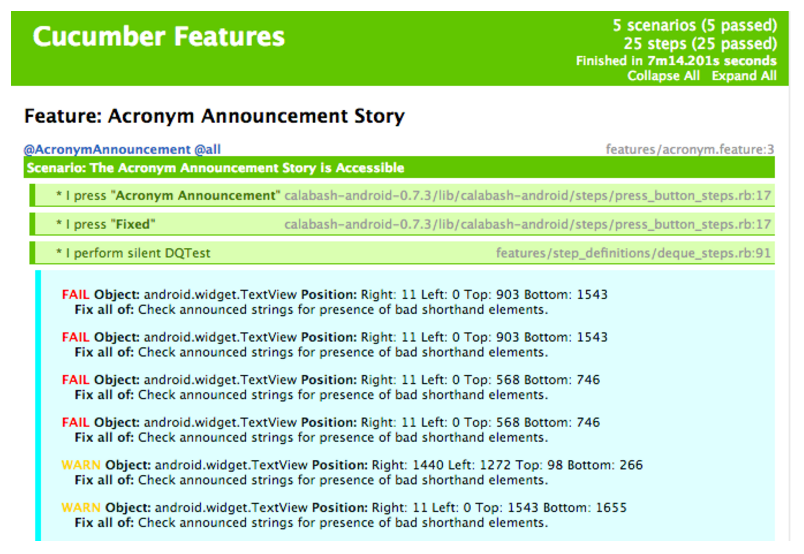
Alt tag=Cucumber Features report including Acronym Announcement Story Feature results including four failing node descriptions and two warning node descriptions.
Notice that the Calabash results collect both the failing and warning nodes, but not the passing ones like other testing I discussed before – I did this for brevity – you can easily add in the passing nodes if you want them displayed.
The Analyzer is a Versatile Tool for Mobile A11y
The Analyzer is a tool that can be used in a variety of ways to ensure that Android applications are accessible. It has a tremendous set of rules that are tailored to the developing WCAG mobile standards. Those who work on developing the analyzer (including myself!) are working closely with developing new accessibility mobile standards, and the rules are linked to these emerging requirements. Another huge plus? The Analyzer is built for both manual and automated testing, making it an optimal tool for any development team.