In an ideal world, organizations would inherently practice accessibility because it is the right thing to do and because it is good for business. While organizations don’t explicitly go out of their way to create inaccessible content, it is oftentimes difficult to prioritize accessibility amongst constantly changing new technologies, tech stacks and development practices.
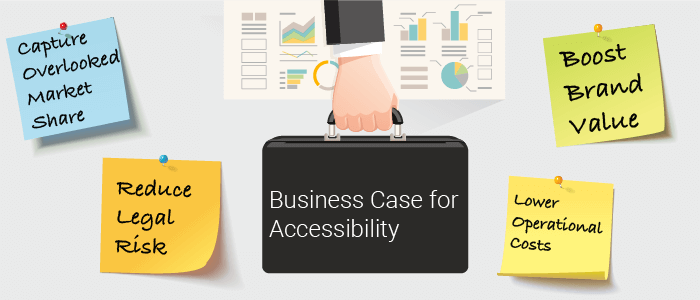
What most organizations don’t realize is that accessibility can unlock a huge, overlooked market share, reduce potential legal risk, lower operational costs, and boost brand value. If organizations only focus on one single aspect of return on investment, they’ll miss some very big positive factors that are a result of having an accessible digital presence.
These positive factors end up helping organizations control costs to the extent that the accessibility efforts can pay for themselves. And, if it’s really done right, accessibility can certainly become a competitive advantage, especially in the eCommerce space.
In this blog post, we’ll be focusing on all four aspects of ROI as they relate to accessibility: capturing an overlooked market share, risk management, lowering operational costs and boosting brand value.
1. Capture a huge, overlooked market share of $490 billion
The first aspect of ROI is that accessibility increases your company market share and increases eCommerce traffic. The total population of people with disabilities is large, and their percentage of disposable income matches their population size.
There are 20 million US working-age adults, roughly 35%, who report at least one disability. In fact, working-age adults who have a disability have a market share of about $490 billion. Comparatively, the African-American market segment is $501 billion, and the Hispanic market segment is $582 billion.
In a recent Nucleus Research report, researchers found that 2% of total eCommerce transactions are completed by people who are blind. This 2% is assuming that less than half of the blind population (which is 5 percent of the total population) are normal eCommerce shoppers and contribute that 2 percent share of total eCommerce. From these findings, we can infer that the total available market for consumers with visual impairments is about $10.3 billion.
Additionally, more than 70% of internet sites of the surveyed blind consumers had some type of critical accessibility blocker. This essentially means that they were either unable to register for the site or complete a purchase. So, if you’re an inaccessible eCommerce business, you could be losing out on up to $6.9 billion annually (70% of the $10.3 billion market share). To put that in perspective, Homedepot.com reported an annual revenue of $6.94 billion in 2018.
Consumers with disabilities who are unable to complete a transaction on a website or app will buy from somewhere else. Not only are you passing up the opportunity to do business with these folks, but you’re also giving your competitors that business by default.
2. Lower Operational Costs
Operational costs are the costs associated with running a business. Most businesses break out these costs by various channels to better understand their business and minimize costs. Most omnichannel organizations wish to push transactions to the digital space to minimize costs.
The four different channels for most organizations are:
- Walk-in, which would be a brick-and-mortar staff facility
- Call-in, which would be brick-and-mortar staffed call center (sometimes these are distributed call centers)
- Mail-in, which is another brick-and-mortar facility that is a staffed mail processing center
- Click-in, which is a virtual website digital transaction
| Channel Type | Target Transaction Percentage by Channel | Actual Transaction Percentage by Channel |
|---|---|---|
| Walk-In | Target 5% | Actual 60% |
| Call-In | Target 15% | Actual 20% |
| Mail-In | Target 20% | Actual 15% |
| Click-In | Target 60% | Actual 5% |
So, let’s calculate what it costs to take payment for each channel, assuming your organization takes 1.5 million payments a month.
| Channel Type | Actual Transaction Percentage | Per-Unit Cost | Total Cost (based on 1.5 Million transactions) |
|---|---|---|---|
| Walk-In | Target 60% | $15.00 | $13.5 Million |
| Call-In | Target 20% | $7.50 | $2.25 Million |
| Mail-In | Target 15% | $2.50 | $562,500 |
| Click-In | Target 5% | $.50 | $37,500 |
If we take the actual percentages for each channel, multiplied by 1.5 million transactions, then take that total and multiply by the per-unit costs, the total cost is $16,135,000/month.
Now, let’s rethink these costs for an organization that decides to improve their accessibility to increase the number of click-in digital transactions for people with disabilities (who would otherwise be walking, calling, or mailing-in due to accessibility blockers).
Statistics show that of the total consumer base, 20-30% are people with disabilities. For a conservative calculation, we’ll assume that accessibility will increase click-in transactions by 10%. In these calculations, we’ll assume this 10% is distributed evenly by 3.33% from the other channels to the digital channels. The new operational costs will now be the following:
| Channel Type | Actual Transaction Percentage | Per-Unit Cost | Total Cost (based on 1.5 Million transactions) |
|---|---|---|---|
| Walk-In | Target 56.7% | $15.00 | $12,757,500 |
| Call-In | Target 16.7% | $7.50 | $1,878,750 |
| Mail-In | Target 11.7% | $2.50 | $438,750 |
| Click-In | Target 15% | $.50 | $112,500 |
With accessibility improvements, the new total operational costs for 1.5 million transactions a month is $15,187,500/month. This is a monthly savings of $1,162,000 and an annual savings of $13,950,00. This revenue is more than enough to cover the costs of a sustainable accessibility program.
One last interesting fact regarding accessibility and operational costs is that internet users who are blind call a company’s customer service department an average of once a week because of website accessibility issues.
In fact, 90% of the interviewees reported that they regularly called customer service multiple times to report an issue, even though they had already abandoned the transaction. In short, if you have problems with accessibility in your digital channel, you are pushing more calls, more traffic, and more work to your call center even if consumers abandon the transaction.
3. Risk Management – Reduce Potential Legal Risk
From 2017 to 2018, web accessibility-related lawsuits skyrocketed 181%, forcing thousands of businesses to react and work toward reaching accessibility compliance in the most expensive and inefficient way possible.
Why the sudden increase? There are two potential factors. Number one is that the digital channel is becoming more important to everybody: companies, customers, or prospective customers. Number two, there is an increase in predatory litigation in this space– in other words, companies are being hit with demand letters or lawsuits from people who are looking for some type of a settlement. However, within these numbers, there are tons of legitimate customers or legitimate prospective customers who are simply trying to use a company’s products or services.
The other trend that we are seeing from these accessibility-related lawsuits is complaints that tend to be aimed towards retail, travel, hospitality, banking, entertainment, food service industry, banking/financial, and self-service sectors.\
Potential Cost of Accessibility Complaints
Real-world numbers from an accessibility-related lawsuit show that legal fees (not including settlement fees) alone could cost you more than $350,000.
| Action | Participant | Hours/Participant | Total Hours | Extended Costs |
|---|---|---|---|---|
| Lawyers Assigned, Business Notified | 8 | 2 | 16 | $3,600.00 |
| Outside Counsel Retainer (Estimate) | – | – | – | $150,000.00 |
| Initial Communication to Involved | 45 | 2 | 90 | $20,250.00 |
| Hold Order Processing | 45 | 3 | 135 | $30,375.00 |
| Outside Counsel Documents | 8 | 8 | 64 | $14,400.00 |
| Initial Discover (Ordered by Judge) | 10 | 24 | 240 | $54,000.00 |
| Status Meetings | 7 | 10 | 70 | $15,750.00 |
| Prep Court Status Hearing | 6 | 5 | 30 | $6,750.00 |
| Prep for Negotiation | 6 | 5 | 30 | $6,750.00 |
| Negotiation | 3 | 3 | 9 | $2,025.00 |
| Settlement Draft | 5 | 5 | 25 | $5,625.00 |
| Settlement Draft Review | 10 | 4 | 40 | $9,000.00 |
| Settlement Finalization | 5 | 2 | 10 | $2,250.00 |
| Settlement Processing | 3 | 2 | 6 | $1,350.00 |
| Hold Older Release | 45 | 2 | 90 | $20,250.00 |
| Close Project, File, Documentation | 8 | 8 | 64 | $14,400.00 |
| Litigation Grand Total | $356,775.00 |
*A blended rate of $250/hour is utilized in calculations.
Potential Cost of Accessibility Lawsuit
Furthermore, accessibility complaints from unhappy customers can result in approximately $994,950 annually. Please see below for my calculations based on my experience as a founder and owner of the Digital Accessibility Program Office for a Fortune 50 Insurance Company: utilized in calculations.
| Action | Participant | Hours/Participant | Total Hours | Extended Cost |
|---|---|---|---|---|
| CSO/Email/Chat Receipt | 1 | .75 | .75 | $90.00 |
| CSO/Email/Chat Accommodation | 2 | .75 | 1.5 | $180.00 |
| Documentation of Issue | 1 | .75 | .75 | $90.00 |
| Processing of Issues | 1 | 1.5 | 1.5 | $180.00 |
| Spool Up Fix Project | 5 | 4.5 | 22.5 | $2,700.00 |
| Design | 1 | 4.5 | 4.5 | $540.00 |
| Code | 1 | 9 | 9 | $1,080.00 |
| QA | 1 | 7.5 | 7.5 | $900.00 |
| Production Issuance | 5 | 4.5 | 22.5 | $2,700.00 |
| Spool Down Project | 5 | 2.5 | 12.5 | $1,500.00 |
| Customer Follow-Up | 1 | .75 | .75 | $90.00 |
| Complaint Grand Total | $10,050.00 |
A blended rate of $120/hour is utilized in calculations.
| Factors | Calculations |
|---|---|
| Scale Factor of Design vs. Production Defect | 100X |
| Proactive Fix Cost in Design | $100.50 |
| Reactive Fix Cost in Production | $9,949.50 |
| 100 Complaints Per Year to Fix in Post Production Could Cost | $994,950.00 |
Using previous IBM studies as a reference, the cost of fixing a defect in production can be as much as 100x more than addressing it in design or development.
Our estimated cost of activities is $10,050 – using this scale factor, it would have cost only $100.50 to fix this defect in the early design or development phase. By subtracting the proactive fix cost from the total reactive fix, you’ve got a loss of $9,949.50.
Even if your organization only receives 10 complaints a year, that’s about a $100,000 loss. With survey/research results showing visually impaired people using call centers for service and complaints about once per week, 100 complaints per year are not hard to imagine.
4. Boost Brand Value – Aligning Your Business with Your Core Values
Today’s consumers consider the business’s core value when they are making their buying decisions. In fact, seven in ten US Millennials actively consider company values when making a purchase – compared with 52% of all US online adults. But it’s not just Millenials who are making value-based consumer decisions. A majority of Gen X consumers explicitly evaluate company values during a purchase, with four in ten young boomers following behind.
Most company core values include words like inclusivity, ease of use, always there, etc. If your company’s mission is to be inclusive, connected, customer-driven, simple, helpful, and customer?centric, how can accessibility not be a part of that? How can you have a company motto or core values that revolve around inclusivity and be excluding or potentially excluding a significant portion of the population of people who want to do business with your company?
In fact, 9 out of 10 blind Internet users are vocal anti-advocates for inaccessible companies, meaning their friends and family members are also making value-based buying decisions and choosing your competitors if your company’s website or application is inaccessible.
In Conclusion
We all wish we lived in an ideal world where accessibility was taught to all developers and treated the same priority as other functional requirements, like security. While accessibility is becoming more and more important and gaining adoption, it is still something that requires additional convincing while companies are in the early stages of building their accessibility programs. The four business reasons above are great data points to take to your executives in order to start advocating for and building a sustainable program for accessibility.