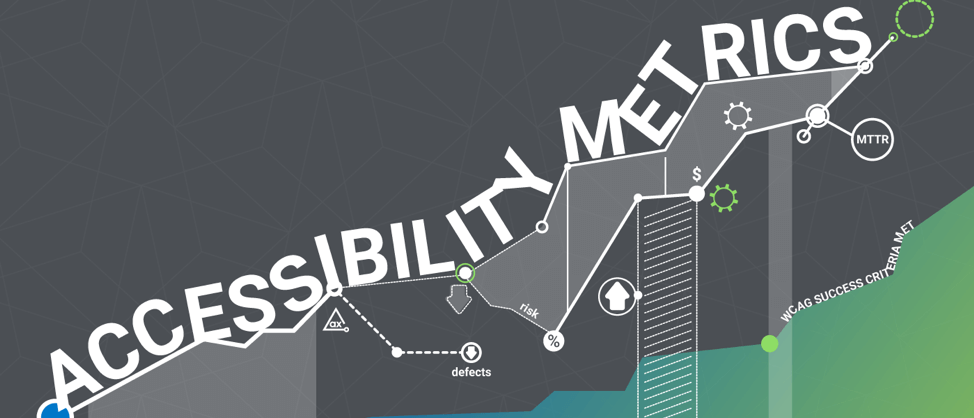
Die Auswahl der richtigen Kennzahlen zur digitalen Barrierefreiheit ist entscheidend für den langfristigen Erfolg Ihrer Bemühungen im Bereich der Barrierefreiheitstests. Um aussagekräftig zu sein, müssen diese Kennzahlen sowohl umsetzbar als auch relevant sein . Lassen Sie uns eine Auswahl geeigneter Barrierefreiheitskennzahlen für das IT-Management, zentrale Barrierefreiheitsabteilungen/-teams (sofern vorhanden) sowie die Geschäftsleitung und Führungskräfte näher betrachten.
Definition umsetzbarer Kennzahlen
Ihre Barrierefreiheitskennzahlen sollten dabei helfen, das Thema Barrierefreiheit in erreichbare, messbare Meilensteine zu unterteilen. Denken Sie daran: Schnelle und einfache Erfolge summieren sich im Laufe der Zeit und können die nötige Rechtfertigung für weitere Investitionen und das anhaltende Interesse an der Umsetzung von Barrierefreiheit liefern. Wenn Sie außerhalb des Entwicklungsteams arbeiten, sollten Sie außerdem bedenken, dass letztendlich die Entwickler für die Behebung Ihrer Barrierefreiheitsprobleme verantwortlich sind. Überfordern Sie sie nicht mit unstrukturierten Maßnahmen.
- Zu beachten: Stellen Sie sicher, dass Ihr Code frei von allen automatisch erkannten Problemen ist, die von einem Testtool wie der Attest-Erweiterung festgestellt wurden.
- Nicht tun: Streben Sie nicht von Anfang an eine 100-prozentige Konformität mit den Barrierefreiheitsrichtlinien an, bei der alle Erfolgskriterien der WCAG 2.1 abgedeckt sind.
Definition relevanter Kennzahlen
Bei der Auswahl der Barrierefreiheitskennzahlen Ihres Unternehmens sollten Sie berücksichtigen, welchem Publikum Sie diese Kennzahlen präsentieren, und welche Rechenschaftspflichten damit verbunden sind. Möglicherweise präsentieren Sie die Kennzahlen Ihrem IT-Management, der zentralen Barrierefreiheitsstelle bzw. dem Barrierefreiheitsteam, der Geschäftsleitung oder der Führungsspitze – und jede dieser Gruppen wird unterschiedliche Anliegen und Leistungskennzahlen haben.
- Maßnahme: Bitten Sie die Entwickler, die durchschnittliche Zeit zu ermitteln, die benötigt wird, um einen Barrierefreiheitsfehler ab dem Zeitpunkt seiner Meldung als Ticket zu beheben.
- Nicht tun: Entwickler nach der Messung der Abdeckung der WCAG-Erfolgskriterien fragen.
Hier sind noch ein paar weitere „Empfehlungen“ für die jeweilige Zielgruppe:
Zentrale Barrierefreiheitsstelle/Team
- Barrierefreiheitsprobleme nach Schweregrad: Anhand dieser Daten kann Ihr zentrales Barrierefreiheitsteam den aktuellen Stand Ihrer Risiken bewerten und strategische nächste Schritte vorschlagen.
- Barrierefreiheitsprobleme nach Kategorien: z. B. ARIA, Farbkontrast, Formulare. Dies kann Ihrem Team dabei helfen, Möglichkeiten zur Verbesserung der Programmier- und/oder Designpraktiken zu identifizieren.
- Trends bei der Barrierefreiheit im Zeitverlauf: Verbessern sich Problem- oder Risikobereiche? Verschlechtern sie sich? Reduzieren Sie die Gesamtzahl der Probleme?
- Die WCAG-Erfolgskriterien wurden bei den ersten Tests in allen Phasen erfüllt: Dies gibt Aufschluss darüber, ob Ihr Entwicklerteam von Haus aus barrierefreie Inhalte erstellt, und hilft Ihnen zu verstehen, wie gut es die Barrierefreiheitsrichtlinien umsetzt.
- Absolvierungsquoten bei Schulungen zur Barrierefreiheit: Wer absolviert die Schulungen? Wer hat Schwierigkeiten, Zeit für die Schulungen zu finden? Wo gibt es Lücken in den Schulungen oder Unterrichtseinheiten, die besonderer Aufmerksamkeit bedürfen? Wann sind aufgrund technologischer Veränderungen neue Schulungen erforderlich?
Produktverantwortlicher/IT-Management
- Barrierefreiheitsprobleme im Entwicklungsteam: Sehen Sie, welche Teams gut abschneiden und welche etwas zusätzliche Unterstützung gebrauchen könnten.
- Noch zu erledigende Arbeiten im Bereich Barrierefreiheit: Zum Beispiel die Anzahl der noch zu behebenden Probleme. Wenn Sie pro Sprint bestimmte Gruppen von Barrierefreiheitsproblemen bearbeiten, sollte der verbleibende Arbeitsaufwand sich auf die jeweiligen Zielgruppen beziehen.
- Tägliche Nettozahl der Barrierefreiheitsmängel: Wie viele neue Probleme treten täglich auf? Im Idealfall sollte diese Zahl sinken.
- Barrierefreiheitsmängel nach Priorität: Helfen Sie Ihrem Team, sich auf die Probleme mit der höchsten Priorität zu konzentrieren.
- Zeitaufwand für die Behebung eines in JIRA gemeldeten Fehlers: Auch bekannt als Reaktionszeit bei der Fehlerbehebung. Diese Zahlen können dazu beitragen, deutlich zu machen, wie viel Aufmerksamkeit Barrierefreiheitsproblemen gewidmet wird und wie ernst sie genommen werden.
- Mittlere Zeit zwischen Ausfällen (MTBF): Wie oft gelangen schwerwiegende Mängel in die Produktion.
- Durchschnittliche Reparaturzeit (MTTR) – wie lange es dauert, schwerwiegende Mängel in der Produktion zu beheben
Geschäftsleitung
- Zusammenfassung der wichtigsten Punkte auf hoher Ebene: Vermitteln Sie den Lesern einen Überblick über die wesentlichen Themen, ohne zu sehr ins Detail zu gehen.
- Barrierefreiheits-Bewertung: Es gibt Tools, die Bewertungen liefern, und Führungskräfte sowie Rechtsabteilungen empfinden diese manchmal als hilfreich. Diese können nach Produkten gruppiert werden.
- Entwicklungen bei der Einhaltung der Barrierefreiheitsvorschriften im Zeitverlauf: Welche Probleme nehmen ab? In welchen Problembereichen sind Verbesserungen zu verzeichnen? Wie entwickeln sich Ihre Teams in Bezug auf ihre Schulung und ihr Verständnis weiter?
- Zeit bis zum Abschluss der Sanierungsmaßnahmen: Anhand Ihrer sonstigen Daten sollten Sie in der Lage sein, eine recht genaue Schätzung abzugeben.
- Aufwandsgrad (LOE) und Kostenschätzungen für die wichtigsten kritischen Hindernisse: Helfen Sie diesen Interessengruppen, die zu erwartenden Auswirkungen zu verstehen.
Führungskräfte
- Risikobewertung
- Es werden wissentlich keine schwerwiegenden Mängel über das Ausnahmeverfahren in die Produktion übernommen.
- Bei den regelmäßigen Produktionskontrollen wurden keine schwerwiegenden Mängel festgestellt.
- Die Ziele hinsichtlich der Barrierefreiheit im Gesundheitswesen werden bei den regelmäßigen Produktionsüberprüfungen erreicht
- Die Kosten für die Integration digitaler Barrierefreiheit werden gesenkt und begrenzt
- Die Kosten für die Integration digitaler Barrierefreiheit werden gesenkt und begrenzt
- Rückläufige Entwicklung der Investitionen im Jahresvergleich bis hin zu einem stabilen Niveau
- Rückläufiger Trend beim Zeitaufwand für den SDLC bis hin zu einem stabilen Niveau
- Entwicklung von der Abhängigkeit von externer Beratung hin zur Eigenständigkeit
- Rückläufige Entwicklung des Umfangs der zentralisierten Barrierefreiheitsfunktion bis zu einem stabilen Niveau
Ergebnisse, die Ihr Unternehmen im Zuge der Verbesserung der Barrierefreiheit erwarten sollte
Wenn Ihre Entwicklungsteams damit beginnen, Barrierefreiheitsmängel zu beheben und zu verbessern, und Ihr zentrales Barrierefreiheitsteam Risiken bewertet und die Schulungen optimiert, sollte die Barrierefreiheit in Ihrem Unternehmen allmählich zu folgenden Ergebnissen führen:
- Die Kosten für die Integration digitaler Barrierefreiheit werden gesenkt und begrenzt
- Die jährlichen Investitionen in die Barrierefreiheit weisen einen rückläufigen Trend auf
- Die Dauer des Entwicklungszyklus für die Behebung von Barriereproblemen weist einen rückläufigen Trend auf
- Die Inanspruchnahme externer Beratungsleistungen und das Outsourcing weisen einen rückläufigen Trend auf
- Die Größe der zentralen Barrierefreiheitsfunktion weist einen rückläufigen Trend auf
All diese anhand der Kennzahlen ermittelten Ergebnisse verdeutlichen, wie die Barrierefreiheitsmaßnahmen Ihres Unternehmens immer effizienter und nachhaltiger werden. Je mehr Sie in Barrierefreiheit als Programm und als kulturellen Wandel investieren, desto mehr wird Ihr Unternehmen in Zukunft im Bereich Barrierefreiheit einsparen.
Zusammenfassung
Die Festlegung der richtigen Kennzahlen für Barrierefreiheit bildet die Grundlage für eine effiziente Kultur der Barrierefreiheit. Die richtigen Kennzahlen liefern die notwendigen Erkenntnisse, um einen Rückstau an Barrierefreiheitsproblemen gezielt anzugehen und zu beseitigen, wobei die Einhaltung der Vorschriften im Vordergrund steht und die Kompetenzen Ihrer Entwicklungsteams im Bereich Barrierefreiheit verbessert werden. Mit den richtigen Kennzahlen und Erfolgskriterien lässt sich Barrierefreiheit sowohl kosteneffizient als auch nachhaltig umsetzen.