


Making Platform React Chart Components Accessible
Login to watch this session!
It’s fast and free, and you get access to the session downloads!
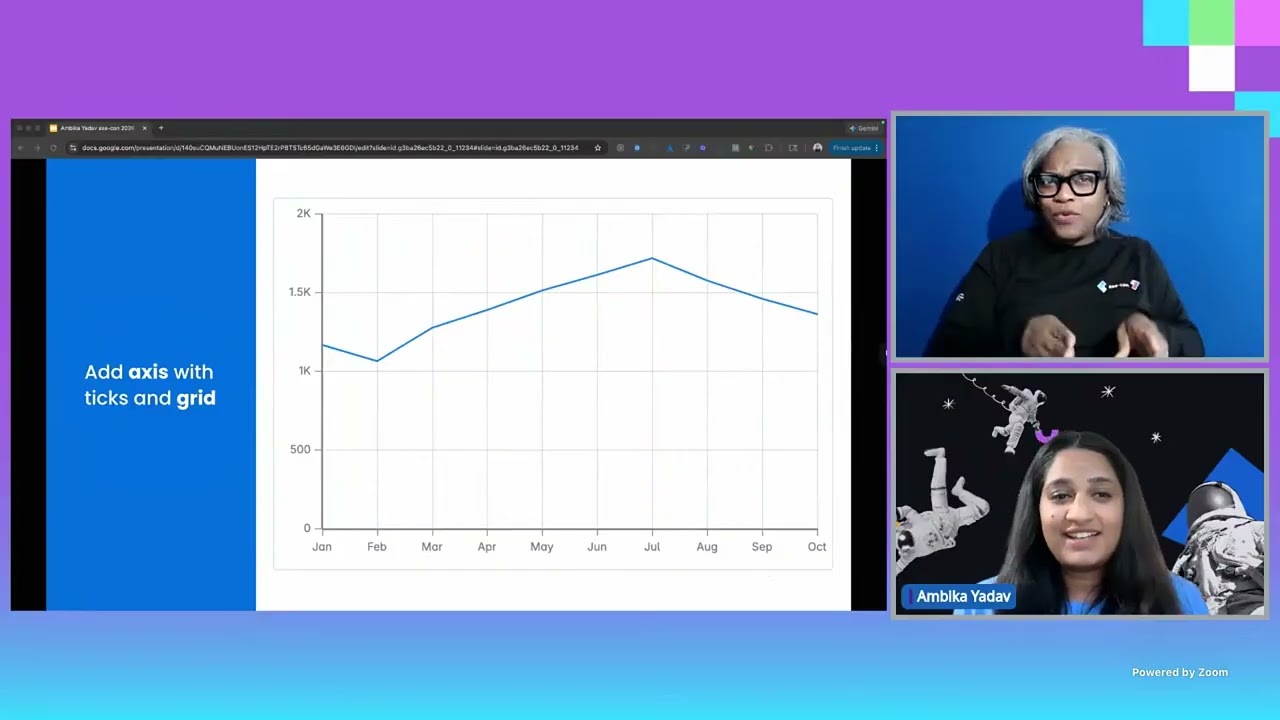
Charts are a fundamental component of web interfaces, yet they frequently pose accessibility challenges for users with disabilities. This talk will provide UI designers and front-end engineers with actionable strategies to enhance chart accessibility, addressing key considerations such as tabular data representation, color usage, keyboard navigation, and screen reader compatibility. Attendees will gain a comprehensive understanding of best practices to ensure data visualizations are both inclusive and aligned with accessibility standards.
Downloads
Login or register for free to access session downloads.